分类目录: html5
vue3+ts项目中使用echarts
Post date:
Author: cyy
Number of comments: no comments
1.安装echarts
cnpm install echarts --save-dev2.代码里直接使用,这里我是封装成一个组件使用
<template>
<div class="chart" ref="ChartContainer"></div>
</template>
<script>
import * as echarts from 'echarts';
import {ref, onMounted, watch} from 'vue'
export default {
name: "LineChart",
setup(props) {
let chart = null;
const ChartContainer = ref(null);
onMounted(() => {
chart = echarts.init(ChartContainer.value);
chart.setOption(getChartSetOption());
window.addEventListener('resize', resizeHandler)
})
const resizeHandler = () => {
if (chart) {
chart.resize()
}
}
return {
LineChartContainer,
}
}
}
function getChartSetOption() {
let option = {
grid: {
top: '20',
left: '40',
right: '20',
bottom: '30'
},
xAxis: {
type: 'category',
axisTick: {show: false},
axisLine: {
show: true,
lineStyle: {
color: "#F2F6FC",
}
},
axisLabel: {
fontSize: 10,
color: "#F2F6FC",
},
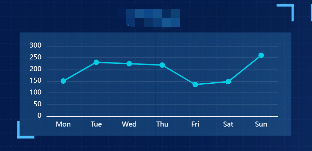
data: ['Mon', 'Tue', 'Wed', 'Thu', 'Fri', 'Sat', 'Sun']
},
yAxis: {
type: 'value',
axisLabel: {
fontSize: 10,
color: "#F2F6FC",
},
splitLine: {
show: true,
lineStyle: {
color: "rgba(255,255,255,0.1)",
width: 1,
},
},
},
series: [
{
data: [150, 230, 224, 218, 135, 147, 260],
type: 'line',
color: 'rgb(2, 205, 230)',
symbol: 'circle',
symbolSize: 8,
}
]
}
return option;
}
</script>
<style scoped lang="scss">
.chart {
width: 100%;
height: 100%;
}
</style>